Write Your First Trading Bot in Python
Tony P.IUX24 Research Team

Latest version only







TopicsMarket Analysis


Latest version only
A laptop, a file of prices, and forty lines. That is the whole setup.
No MetaTrader. No broker. No API key. No money at risk.
You need Python, one CSV file, and about forty lines. At the end you will have a bot that traded EURUSD for five years and made +1.7%. That is not a typo, and it is not a failure — it is the whole lesson. Everything here runs offline on a laptop with zero pip install.
Say it out loud first, in one sentence:
That's it. No AI, no indicator soup, no prediction. Two averages and a comparison.
Every chart lies to you after the fact. Every move looks obvious once you already know what came next. A backtest is the only thing that tells you whether a rule you can state in one sentence would actually have paid.
A bot is a machine small enough to see all of: prices in, one lever out.
A daily bar is one line of a story: what the price was when the day ended. Everything that happened that day — the oil headline, the central-bank leak, the panic at 3pm — got squeezed into that one number. That compression is exactly why it is safe to start here.
get_data.py pulls 1,300 daily EURUSD closes, 2021-09-21 to 2026-09-22, from Yahoo's public chart endpoint. Standard library only.
import csv, datetime, json, urllib.request

URL = ("https://query1.finance.yahoo.com/v8/finance/chart/EURUSD=X"
       "?range=5y&interval=1d")

request = urllib.request.Request(URL, headers={"User-Agent": "Mozilla/5.0"})
with urllib.request.urlopen(request) as response:
    chart = json.load(response)["chart"]["result"][0]
Run it once. You now own a CSV that nobody can take away, revise, or rate-limit.
An average of the last 20 closes moves fast. An average of the last 50 moves slow. When the fast one is above the slow one, price has been drifting up for a while. That's the entire signal.
def average(values):
    return sum(values) / len(values)

fast = average(closes[i - 20:i])
slow = average(closes[i - 50:i])
Two lines. No library. numpy does not make this more correct, only shorter.
Why would this work at all? Because currencies do sometimes run in one direction for weeks at a time. A crossover rule is a bet that streaks like that last a little longer than the noise around them.
The fast average passes the slow one. That is the entire signal.
Walk forward one day at a time. Buy when the rule turns true, sell when it turns false, record what happened.
for i in range(SLOW, len(closes)):
    price = closes[i]
    fast = average(closes[i - FAST:i])
    slow = average(closes[i - SLOW:i])

    in_market = units > 0
    should_be_in = fast > slow

    if should_be_in and not in_market:
        entry = price + SPREAD
        units = cash / entry
        cash = 0.0
    elif in_market and not should_be_in:
        exit_price = price - SPREAD
        cash = units * exit_price
        trades.append(exit_price / entry - 1)
        units = 0.0
Read it once more. There is no cleverness in there to hide a mistake behind. That is the point of writing it yourself instead of downloading somebody's framework.
Look at the slice again: closes[i - FAST:i]. It stops before i. Today's close is not in today's average.
Change it to closes[i - FAST:i + 1] and your returns jump. They jump because the bot is now deciding using a number it could not have known until the day was over. Every fake-rich backtest on the internet has some version of this in it.
A day's close is a fact only after the day ends. At 9:31am it does not exist yet, so your bot is not allowed to know it.
Peek at the card before you bet and every backtest gets rich. That is the bug.
Put costs in before you look at profit, never after. One pip each way:
SPREAD = 0.0001
entry = price + SPREAD
exit_price = price - SPREAD
Two pips per round trip sounds like nothing. Sixteen trades of it is 0.3% of the account — about a fifth of everything this strategy made. Costs are not a footnote, they are the thing that decides whether a small edge survives.
Two pips a round trip. The coin comes out smaller every single time.
bars            1300
trades          16
win rate        25%
final equity    10,168  (from 10,000)
strategy return +1.7%
buy and hold    +1.0%
max drawdown    -9.9%
Five years. Sixteen trades. Three quarters of them lost money. The bot beat doing nothing by 0.7 percentage points, and it beat it only because the few winners ran long enough to pay for the crowd of small losers.
This is what a trend rule looks like in a market that mostly went sideways, which is the normal state of a major currency pair.
Your first real feeling here should be disappointment. Keep it. It is worth more than a screenshot of somebody's 400% equity curve.
+1.7% against +1.0%. Sixteen trades of work bought the sliver on the right.
max drawdown -9.9%. That is the deepest hole between a peak and the next recovery. To earn 1.7% you had to sit through being down nearly 10% and not touch anything.
Scale it up and the question stops being about returns at all. It becomes: would you still be holding at the bottom of that hole, or would you have switched the thing off one day before it recovered?
def max_drawdown(curve):
    peak = curve[0]
    worst = 0.0
    for value in curve:
        peak = max(peak, value)
        worst = min(worst, value / peak - 1)
    return worst
Eight lines. Print it before you print profit.
The drawdown is the hole you had to sit in to collect the gain.
20 and 50 were picked out of the air. What if other numbers are better? Try them all — that is sweep.py, and it is fifteen lines:
for fast in range(5, 61, 5):
    for slow in range(10, 201, 10):
        if fast >= slow:
            continue
        bot.FAST, bot.SLOW = fast, slow
        ...
204 combinations. Here is what comes back:
combinations   204
profitable     43%
median return  -0.6%
best     5/30   +10.7%   25 trades   -10.4% drawdown
worst   40/60   -11.4%   13 trades   -12.8% drawdown
So there is a great setting: 5/30 made +10.7%. Post that one and you look like a genius.
But look at the whole table instead of the top row. The median setting lost money. Fewer than half were profitable at all. The gap between the best and worst is 22 points of return on the exact same data with the exact same code — which means the winner is mostly luck, and you only know which one won because you already saw the answers.
That is overfitting, and it is the reason a strategy that is beautiful on old prices dies on new ones. The world underneath the parameters does not sit still, and the setting that fit the last five years was chosen by those five years.
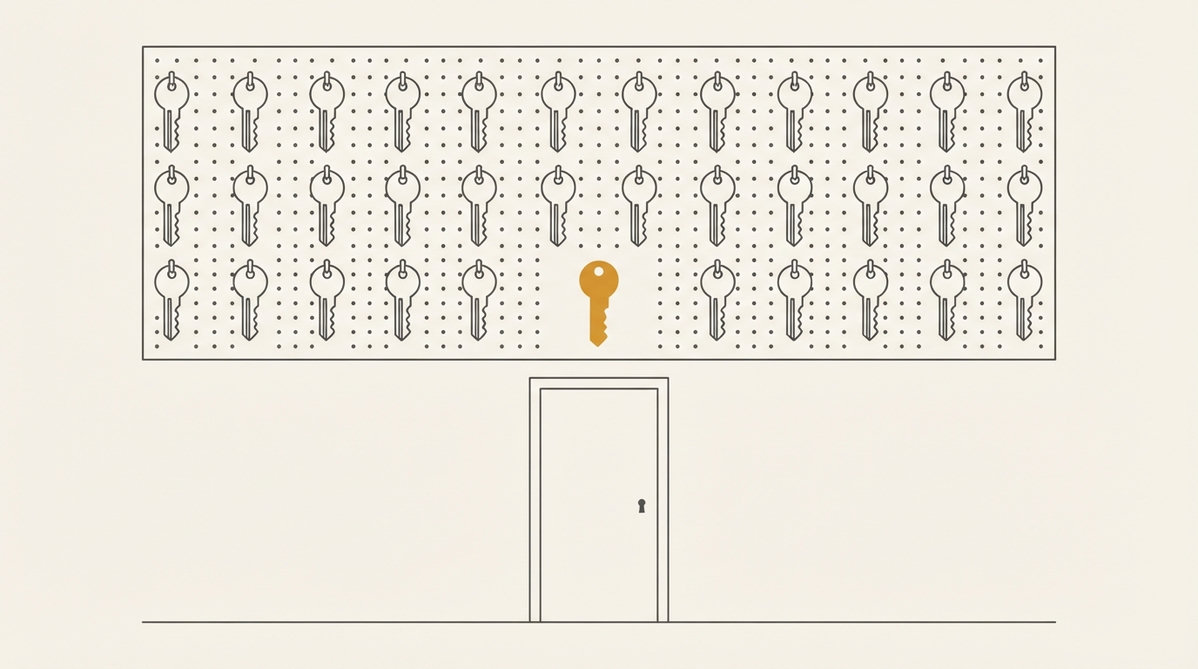
204 settings, one that fits. You only know which one after you have seen the lock.
Honest list, short:
It held a walker for five years. That is not a load test.
A backtest does not tell you what a strategy earns. It tells you what you would have had to survive to find out.
The whole thing: get_data.py (20 lines), bot.py (40 lines), sweep.py (15 lines). Standard library, one CSV, no account anywhere. Change FAST, SLOW, SPREAD and run it again — that loop is the actual skill.
Comments