A $2 Stock Can Be More Expensive Than a $250 One — And Most People Can't Tell
Tony P.IUX24 Research Team

เห็นเฉพาะฉบับล่าสุด

หัวข้อที่เกี่ยวข้องPersonal Finance


เห็นเฉพาะฉบับล่าสุด
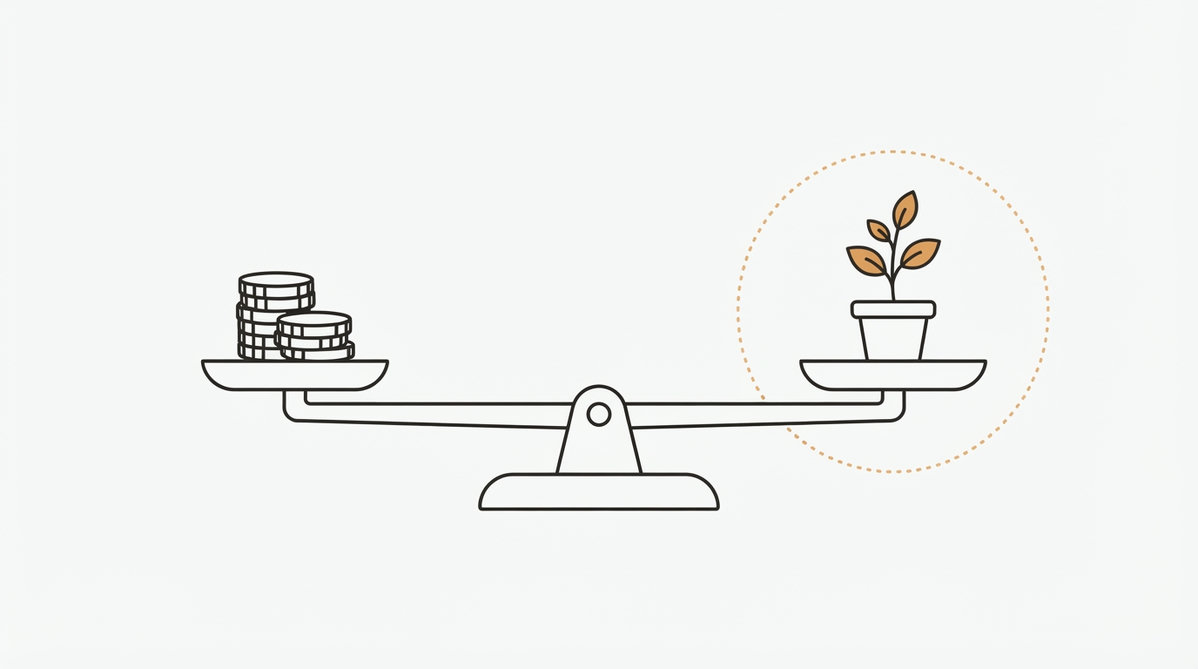
What you pay sits on one side of the scale. What you receive sits on the other.
11 sections. Ten minutes. You'll stop judging stocks by the number on the ticker.
Educational only. Not investment advice.
The company we'll use throughout — Harborline Noodles, a 120-location chain: Revenue $800M · Net income $80M · 200M shares outstanding · $8 per share
An $8 stock is not cheaper than a $250 stock.
Run a 10-for-1 split and that $250 stock becomes $25 overnight. The business didn't change by a cent — only the number of slices it was cut into. Judging by the ticker price is judging by the size of the knife.
The question that actually matters: what are you paying today, for how much future business?
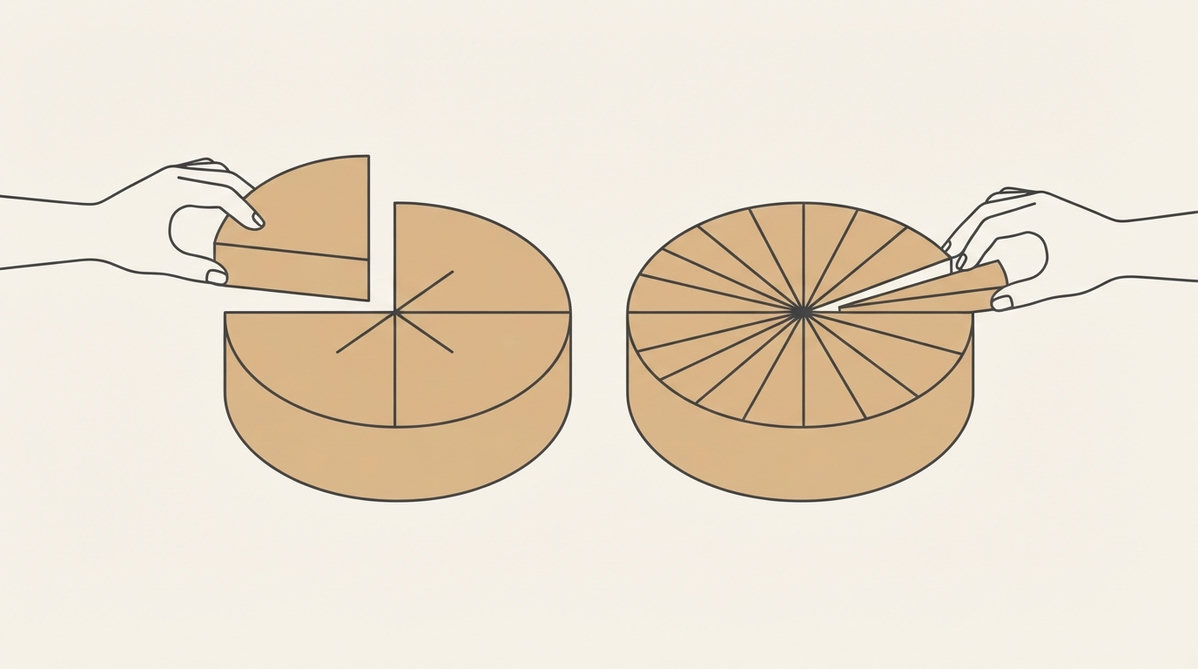
Same cake either way. Take a quarter and the gap is a quarter; take a sixteenth and the gap is a splinter — cutting it into more slices makes each slice thinner, not the cake bigger.
Buying a share makes you a part-owner of a real business. The money moves through four stations:
Station | What happens | What comes out |
|---|---|---|
1. Customers | People walk in, order, pay | Revenue $800M |
2. Costs come out | Beef, noodles, wages, rent, utilities, tax | Accounting profit $80M |
3. Counted as cash | A different number entirely (see below) | Operating cash $100M |
4. Outside capital | Borrow, or issue new shares | The pile on management's desk |
Profit ≠ cash, because:
Two ways to add capital. Each has a price:
Route | What it costs you |
|---|---|
Debt | Interest, plus repayment even in a bad year |
New shares | Your existing shares now own a smaller slice — dilution |
This is what separates a ten-bagger from a stock that goes sideways for a decade.
The menu: maintain what exists · open locations · acquire · pay down debt · pay a dividend · buy back stock · sit on the cash
Get it right and it becomes a loop:
Get it wrong and the money simply disappears — dead locations, menu items nobody orders, an acquisition bought at twice what it's worth.
$80M profit ÷ 200M shares = EPS $0.40Two headlines that read the same and mean the opposite:
What happened | The math | EPS | What you got |
|---|---|---|---|
Profit doubles, share count doubles | $160M ÷ 400M shares | $0.40 | Nothing |
Profit flat, 20% of shares bought back | $80M ÷ 160M shares | $0.50 | +25% |
A bigger company does not mean a richer shareholder. Always look per share.
Nobody buying today is paying for last year's earnings. They're paying for the earnings they believe will show up over the next twenty years.
If the market becomes convinced EPS is heading from $0.40 to $1.20, buyers pile in now, before it happens. The optimism is already inside today's price.
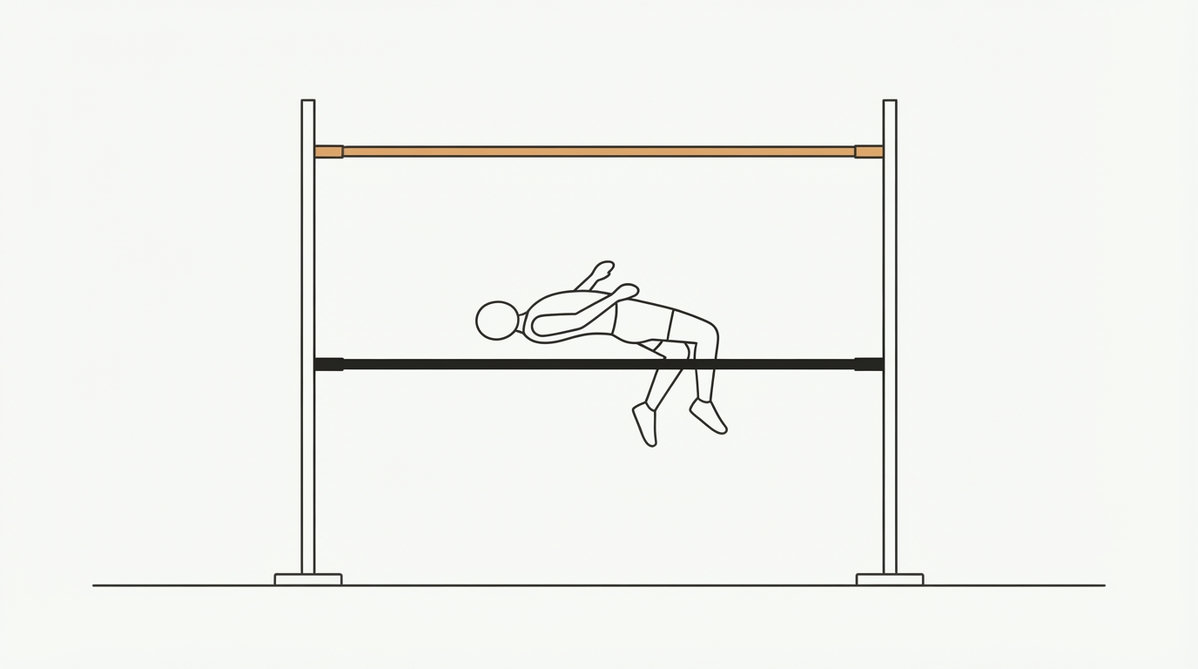
The price assumes 30% growth → the company delivers 18% → the stock falls, even though earnings genuinely went up.
Clearing your own bar beautifully still loses if the market set its bar higher — 18% growth, stock down.
$8 ÷ $0.40 = P/E of 20Read it as: pay $20 to buy $1 of this year's profit.
The trap almost everyone falls into — bad earnings push the P/E up, not down:
Earnings halve to $0.20 → $8 ÷ $0.20 = P/E of 40The business got worse and the multiple went up, because P/E doesn't measure quality. It divides price by earnings. That's all it does.
What you see | What it usually means |
|---|---|
Low P/E | The market doesn't believe these earnings will last |
High P/E | The market expects much more earnings later |
A high P/E isn't a reason not to buy. It's a warning that you need more conviction about the future than usual.
P/E uses one year of earnings. If that year was strange, the ratio is meaningless.
Situation | The P/E you see | What's actually true |
|---|---|---|
Sold a property, booked an $80M one-time gain | Drops from 20 to 10 | Not one extra bowl of noodles was sold, and there's no second property next year |
Closed 15 losing locations, big one-time charge | Looks expensive | Next year the drag is gone — real earnings are better than they look |
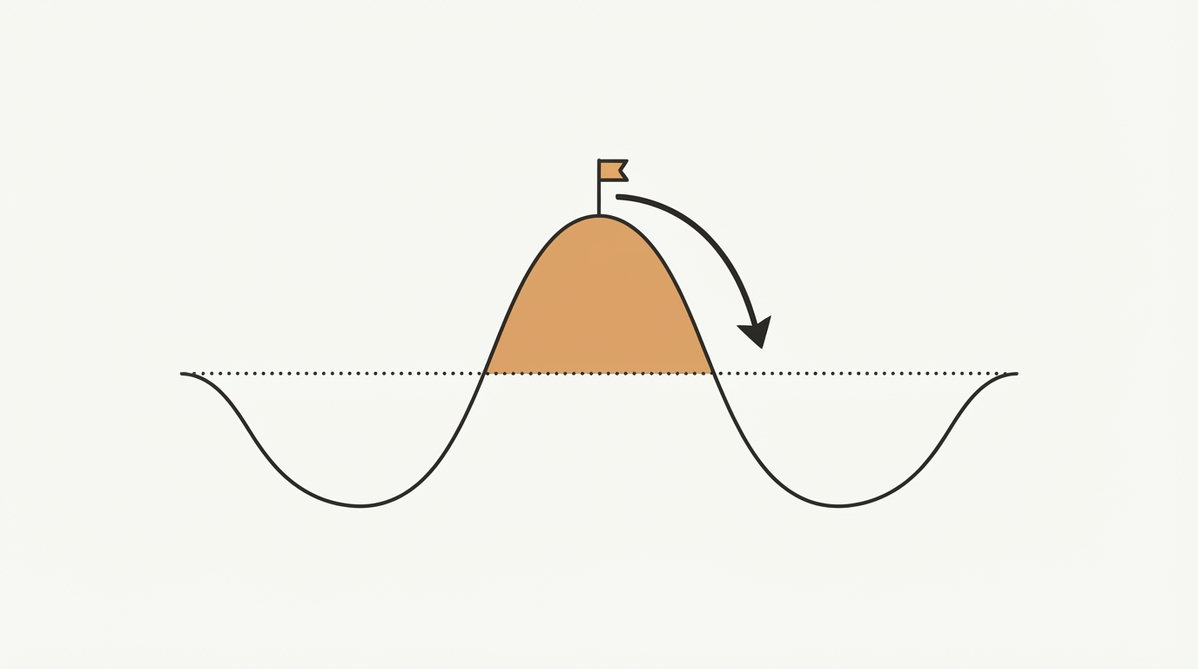
A cyclical at the top of the cycle | The lowest it ever gets | The most dangerous moment — when the cycle turns, the bargain evaporates |
Cyclicals: airlines, automakers, homebuilders, miners, petrochemicals.
The fix is normalized earnings — estimate what the company earns in an ordinary year, neither boom nor bust, and divide by that instead.
The point where the P/E looks cheapest is the point where earnings are most abnormally high — and closest to the fall.
Accounting profit can be shaped. Cash is harder to shape. And dividends, buybacks and debt repayments come out of cash, not out of accounting profit.
Line | Amount | |
|---|---|---|
Operating cash flow | $100M | |
− | CapEx — new locations, replacing equipment. Not optional: skip it and the doors don't open | $36M |
= | Free cash flow | $64M |
$64M ÷ 200M shares = $0.32 of FCF per share
The red flag — profit looks great every year but FCF is weak every year. There are only two explanations:
Investing heavily for the future | Fine, if the investment earns its keep |
The business eats cash by nature | Dangerous — paper profit that never becomes money |
The drain takes its share before anything is left over. The tank sits under half full; the paper beside it draws the same tank nearly to the brim.
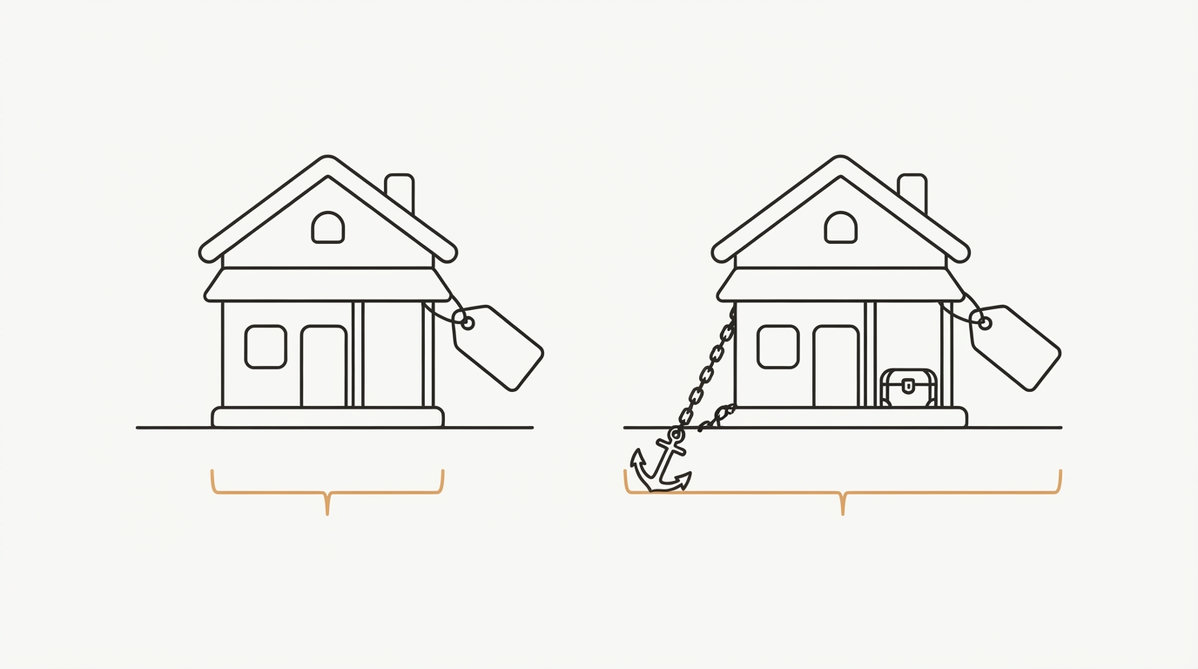
Buy a house from someone and it comes with a mortgage attached, you're taking on both. The real cost is the two together.
Line | Amount | |
|---|---|---|
Market cap = $8 × 200M shares | $1,600M | |
+ | Interest-bearing debt | $300M |
− | Excess cash | $100M |
= | Enterprise value | $1,800M |
Two companies can both have a $1,600M market cap — but if one carries no debt and $500M of cash while the other carries $800M of debt, you are not looking at the same deal.
EV/EBITDA is useful for comparing companies financed very differently. But EBITDA is not cash: it pretends depreciation isn't real, when the fryers really do wear out and really do have to be replaced in five years. Use it as a cross-check, never on its own.
Same price tag, but one comes with a mortgage — equal market caps don't mean equal cost.
# | Ask | Why it matters |
|---|---|---|
1 | How fast is it growing? | Per-share earnings and cash, in percent per year |
2 | How long can it keep growing? | 20% for two years and 20% for ten years are worlds apart — this matters more than #1 |
3 | How certain is that growth? | Repeat customers are not the same as a hopeful forecast in a crowded market |
4 | What are the margins? | How much of each extra dollar of sales becomes profit — high volume on thin margin is running to stand still |
5 | Is there a moat? | How easily can a competitor copy this and take the customers |
6 | Is there anywhere left to invest? | 200 more locations to open, or every good site already taken |
7 | What could break it? | Input costs, wages, regulation, technology, a key person walking out |
The trade-off to remember: the faster, longer and more certain the growth, the more it is rational to pay · but the more you pay, the less room you have to be wrong.
Why a P/E of 25 can be cheaper than a P/E of 8:
P/E | Condition | |
|---|---|---|
Stock A | 25 | Loyal customers, plenty of room to expand, margins widening every year |
Stock B | 8 | Sales down 5% three years running, competitors taking share |
Paying 8x for a business that is melting is more expensive than paying 25x for one that is getting stronger.
Level 1 — against peers. P/E, P/FCF, growth, margins, debt, room to reinvest. If it trades at a premium, name what justifies it. If you can't name it, you're paying that premium for nothing.
Level 2 — against its own history. Normally 20x, now 14x. There are always two explanations: the market is having a mood (opportunity), or something fundamental changed (the lower price is the correct price). Historical averages give context, not a law of nature.
Level 3 — compare two stories. This is the one that matters.
If the price assumes | Then |
|---|---|
Less than the evidence supports | The market may be too pessimistic → possibly cheap |
About what the evidence supports | Fairly valued — no edge here |
Far more than the evidence supports | It needs years of near-flawless execution → possibly expensive |
The goal isn't the lowest price or the lowest P/E. It's to understand a business well enough to judge how good it is at turning today's capital into tomorrow's value per share — and then to check whether the price still leaves you room to be wrong.
Because you will be wrong. The only question is what you paid when you were.
The dotted ring around the sapling is your room to be wrong — the more you pay, the tighter it gets.
Metric | Formula | Answers |
|---|---|---|
EPS | Net income ÷ shares | What one share earns |
P/E | Price ÷ EPS | How many times accounting profit you're paying |
FCF | Operating cash − CapEx | What's actually left over |
P/FCF | Price ÷ FCF per share | How many times free cash you're paying |
FCF yield | FCF per share ÷ price | Cash generated per year per $100 paid |
Market cap | Price × shares | What the equity is worth |
Enterprise value | Market cap + debt − excess cash | What the whole business really costs |
EV/EBITDA | EV ÷ EBITDA | Comparison across capital structures (ignores CapEx) |
ความคิดเห็น